Measure Page Speeds with Core Web Vitals
Discover how to measure page speeds effectively with Core Web Vitals: LCP, FID, and CLS. Understand Google's key metrics for ranking and how they impact user experience. Explore both lab and real-user tools for comprehensive speed analysis.

How speedy a page loads looks like a simple question. You clock the time it takes in controlled situation and there you go. The reality is a bit more complex. You want to track and analyse the experience of real users. There are loads of different browsers, network speeds, devices, screen sizes and dependencies on third parties. A visitor is not happy when they can see the page but not really click on it. The speeds of your own servers or of third parties you rely on might fluctuate and the experience of speed is subjective.
There are many metrics in use and ideally you would want to boil them down to the essence, a core. Something as many people agree upon as possible to make the metrics also have authority and to make them exchangeable. A bit like the civic time. Agreeing on strong metrics also provides a proper fundament for measuring optimization and improvements.
Core Web Vitals
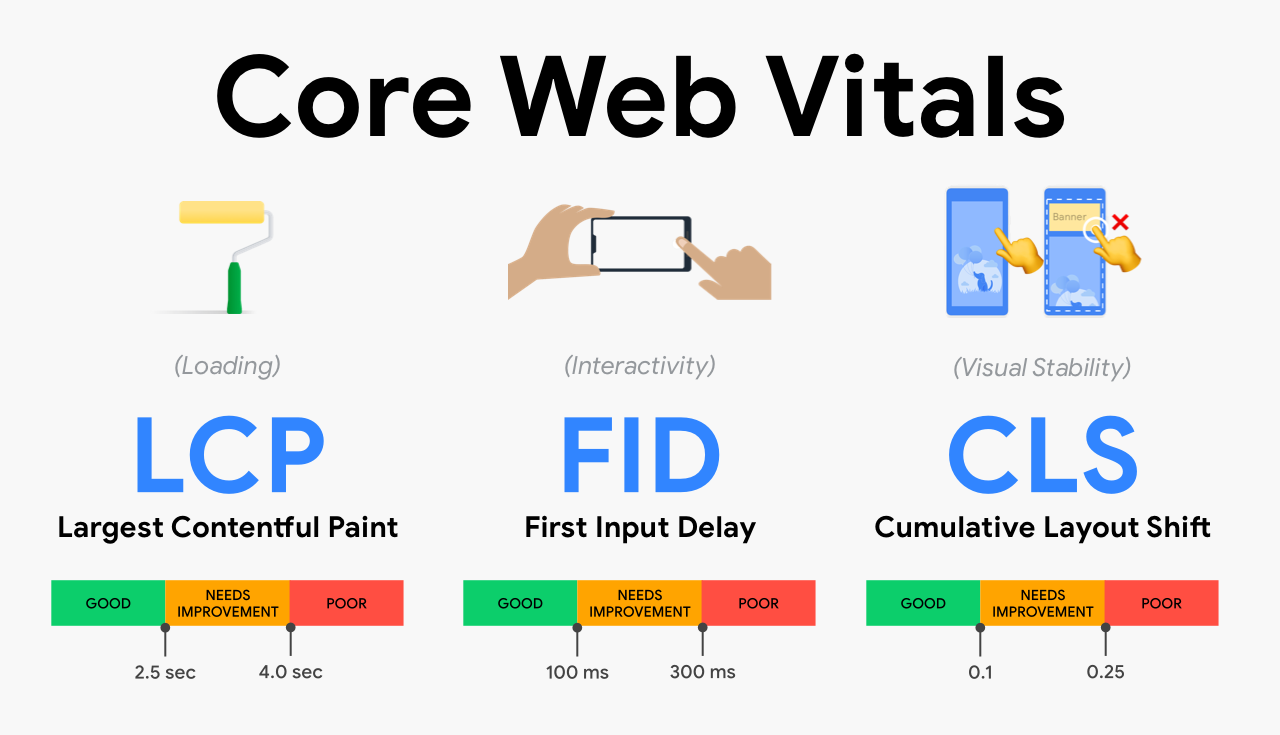
Google has the power, the tools and the brains to set some standards. And even if you don’t agree you probably will suffer because the standards are more and more part of how Google ranks your pages. The standards Google now have set for Page Speeds, and made part of their key tools, are called Core Web Vitals. Google boiled the metrics soup down to three key figures:
- Largest Contentful Paint (LCP)
- First Input Delay (FID)
- Cumulative Layout Shift (CLS)

Largest Contentful Paint (LCP)
Largest Contentful Paint (LCP) is all about loading. LCP measures loading performance. To provide a good user experience, LCP should occur within 2.5 seconds of when the page first starts loading. The Largest Contentful Paint (LCP) metric reports the render time of the largest image or text block visible within the viewport.
First Input Delay (FID)
First Input Delay (FID) measures interactivity. When can the user start interacting with the page. To provide a good user experience, pages should have a FID of less than 100 milliseconds.
FID measures the time from when a user first interacts with a page (i.e. when they click a link, tap on a button, or use a custom, JavaScript-powered control) to the time when the browser is actually able to begin processing event handlers in response to that interaction. For the actual individual visitor this probably best translates to how the interaction feels. Does something happen instantly when I click/tap or do I sense delay. Note that this is something that is measured by recording real usage (see below).
Cumulative Layout Shift (CLS)
Cumulative Layout Shift (CLS) measures visual stability. Is the layout stable or are there shifts in how the content is presented. To provide a good user experience, pages should maintain a CLS of less than 0.1.
These layouts shifts you would probably call flickering. You want to press a link and then suddenly something pops up or rearranges itself. Very annoying at times.
To minimize layout shifts, reserve enough space for UI elements that may be loaded in late. Fixed dimensions for banners, images etc. help. pic.twitter.com/aaIjeyscqy
— Addy Osmani (@addyosmani) December 2, 2020
Addy Osmani on Cumulative Layout Shifts
Measurement tools for page speeds
The tools you can use to measure the above key values come in two types. The first is a lab set up and the second field work.
Measure in the lab
You provide the URL of the page and then this is tested for speed. You can use Pagespeed Insights or the Lighthouse module in the Chrome browser. These tools provide separate reports for mobile and desktop. There is also a chrome browser extension.
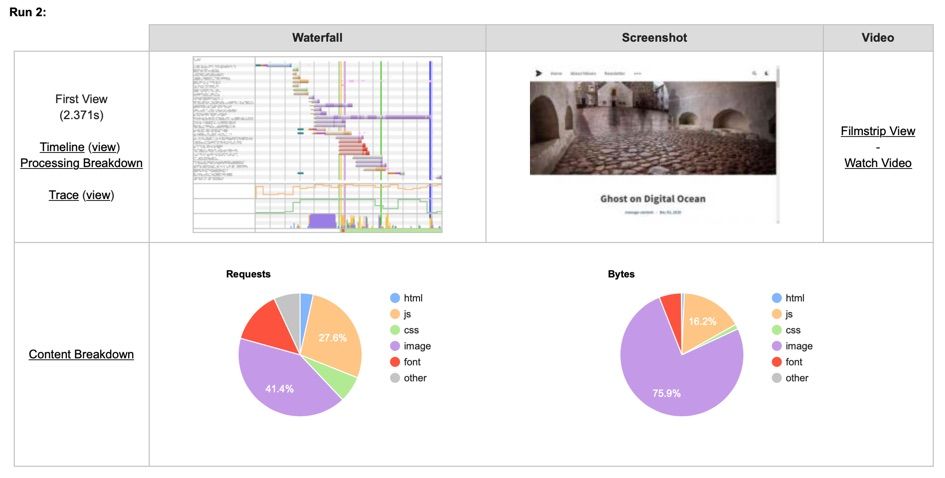
I really like the excellent service that Webpagetest offers. It offers great visual and detailed insights and it uses Web Vitals.

Measure in the field
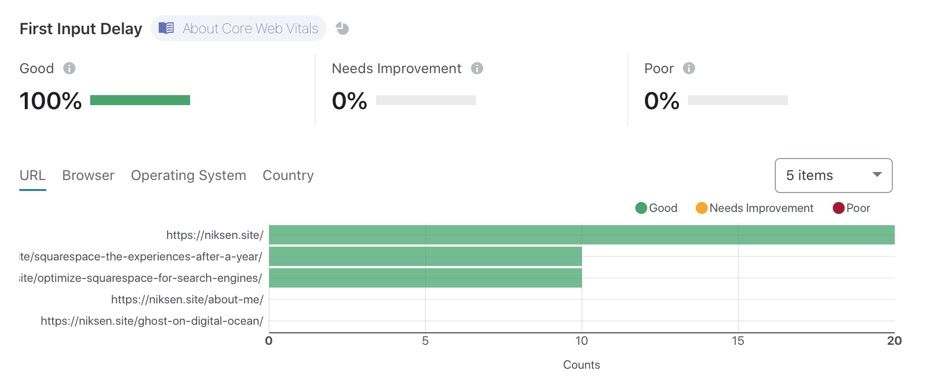
The second type is called Real User Measurement (RUM). With this type the actual cumulative speeds in the wild are used. Sort of field work. It is also the only way to find First Input Delay because this needs real users to click around. For this site I use the excellent reporting module in the Cloudflare CDN.

Web vitals essential metrics


